- 교육
- Desarollo de Habilidades
- Análisis Gráfico Simplificado
Análisis Gráfico Simplificado
¿Alguna vez te has preguntado cómo los traders pueden prever los movimientos del mercado solo con mirar un gráfico? El secreto está en dominar el análisis gráfico, una habilidad que puede transformar tus decisiones de trading y elevar tu éxito.
- Fundamentos del análisis gráfico: Estudia los patrones de precios en los gráficos.
- Reconocimiento de tendencias: Alinea tus operaciones con la dirección del mercado.
- Soporte y resistencia: Identifica niveles clave de precios.
- Reversiones de tendencia: Detecta señales que indican cambios en el mercado.
Fundamentos del análisis gráfico
El análisis gráfico se basa en el principio de que las acciones históricas del precio suelen repetirse, formando patrones y tendencias reconocibles. Este método funciona porque la psicología del mercado, que impulsa las decisiones de put o call, tiende a mantenerse constante a lo largo del tiempo. El análisis gráfico consiste en estudiar patrones pasados de precios en gráficos para anticipar los movimientos futuros del mercado. Esto establece la base para tomar decisiones informadas y obtener mejores resultados en tus operaciones.
Reconocimiento de tendencias
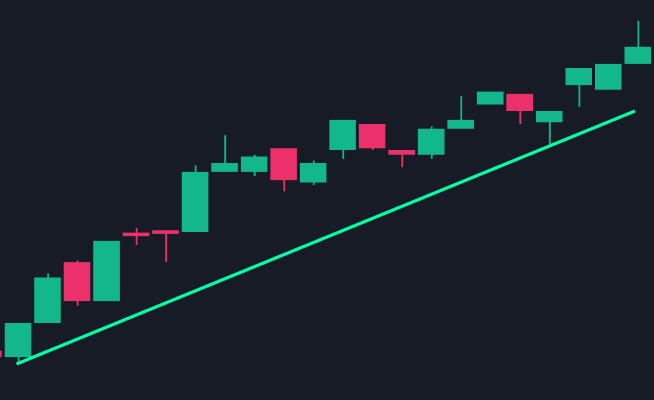
Seguir las tendencias del mercado puede mejorar significativamente la efectividad de tus operaciones. Aquí te mostramos cómo hacerlo:
-
Observa los altos y bajos: Busca una serie de máximos y mínimos más altos para una tendencia alcista, o mínimos y máximos más bajos para una tendencia bajista.
-
Confirma la dirección: Asegúrate de la consistencia del patrón durante un periodo para confirmar la dirección de la tendencia.
-
Alinea tus operaciones: Opera en la dirección de la tendencia confirmada para aumentar el potencial de éxito.
Soporte y resistencia
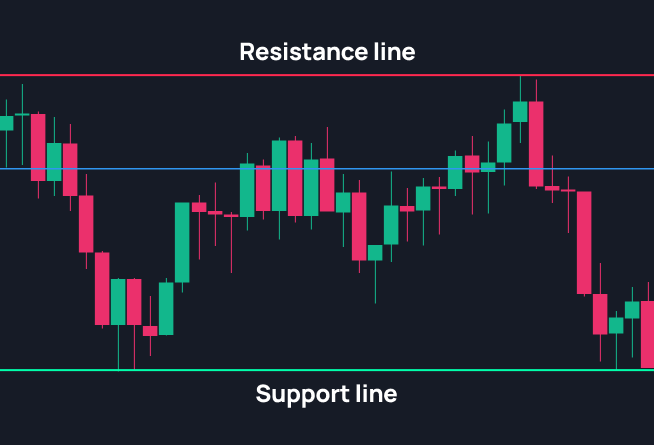
Las líneas de soporte y resistencia indican dónde los precios tienden a rebotar o caer. Puedes identificar estos niveles trazando líneas horizontales en puntos de reversión o consolidación de precios, lo que señala áreas de presión significativa de compra o venta.
Reversiones de tendencia
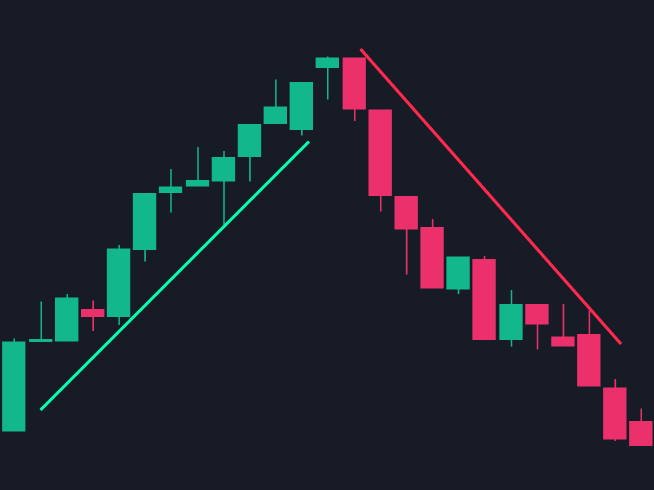
Detectar la dirección principal de una tendencia y las señales de su cambio es fundamental. Los cambios en niveles clave pueden anticipar próximos movimientos en la dirección del mercado.
Dominar el análisis gráfico puede mejorar considerablemente tu estrategia de trading, ofreciéndote una visión clara de las tendencias del mercado y niveles clave. Comienza a aplicar estos principios en tus operaciones para navegar el mercado con confianza.